
Summary
- Industry: Finance
- Location: Headquartered in the U.S.
- Size of the project team: 3 experts
- Technologies: Data Crawling, fastText, gensim, kNN, Clusterization, Text Classification.
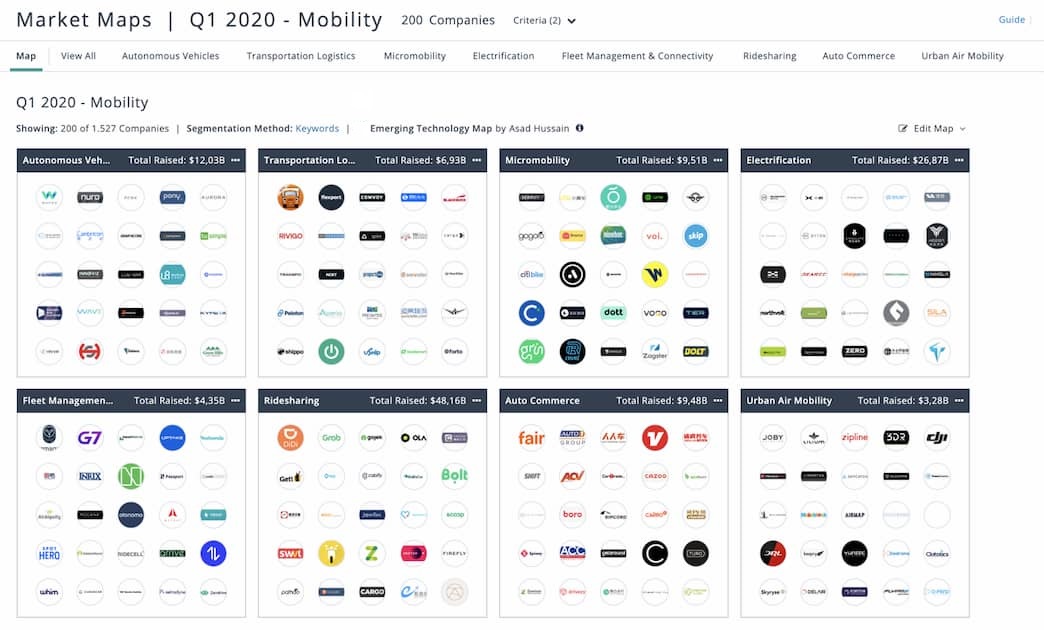
- Services: A visual representation of сompany clusters based on similarity and user-defined criteria.
- Expertise delivered: Custom Software Development, support.
Challenge
SPD Technology has implemented this project for a leading US-headquartered provider of financial data and technology. The company caters to venture capital, private equity, and public markets worldwide. The database of the client’s platform contains information on 3.5 million companies, 1.9 million deals, 450 000 investors, and 108 000 funds. Prior to the commencement of the project under review, we had been cooperating with the client for over 13 years, having started as a small development team and gradually grown into their principal full-cycle technology provider.
The client conducted a market research and learned that their competitors already had a solution similar to the market map solution they had in mind. They requested us to refine their vision of the product and implement the product as a separate service with a visual interface, flexible functionality, and some additional features.
The purpose of the client’s Market Map solution is to assist investors in locating investment opportunities in various industries. In order to provide this, the application allows classifying companies in accordance with the complex hierarchies of their corresponding industries and verticals. It continually and dynamically adjusts and updates the company-related information in accordance with any actual changes this information has undergone. Currently, the system updates company information on a daily basis.
Don't have time to read?
Book a free meeting with our experts to discover how we can help you.
Book a MeetingImportantly, the solution classifies businesses by both Industry (a basic classification, like Healthcare, Aircraft, or Banking) and Vertical (a logic-based classification with customer-defined bespoke parameters). Thus, the application has the ability to group businesses in accordance with what they actually engage in currently, and not simply in accordance with the industry they represent. The user can make a search for investment opportunities by using multiple criteria that include Industry, Vertical, Сompanies, and Deals. The application displays a total amount of investment an industry has drawn.
At present, the solution is a fully functional service. Its database holds information on more than 2 million companies.
Solution
To implement the project, we created a Data Science project team that consisted of two data scientists and a Team Lead.
It has taken our project team 9 months to fully implement the Market Map solution on time and budget.
Technical Solution
The client had a database of company descriptions, in which the companies’ verticals were indicated. Each company was assigned a certain number of keywords. To implement the solution, our project team needed to clusterize these descriptions, verticals, and keywords.
Basically, we needed to implement three Machine Learning-driven functions: vectorization, clusterization, and the naming of the resulting clusters.
It was a challenge to determine the right number of clusters. Another challenge we’ve encountered was the need to select a suitable hierarchy for the industry codes, sectors, and verticals. The clusterization process had to be repeated numerous times, as each of the companies was operating in several different areas. Each of the industries and verticals had its own hierarchy with multiple levels. The hierarchies needed to be made adjustable in accordance with the required degree of detail. Finally, not all the companies had a complete or accurate enough description, making it all the more difficult to group them correctly. The naming of the clusters posed a problem too because there were around 600,000 keywords and 400,000 of them could only be used once. Our project team had to deal with this by trial and error.
Our experts turned the company descriptions into vectors and clusterized them by using Machine algorithms. For vectorization purposes, the project team has tried fastText, Word2Vec, and Doc2Vec, and opted for fastText as the best option.
Result
The client has received a first-rate tool that has allowed them to make their platform a great deal more useful and appealing to their investor target audience.
To illustrate, 36% of the users, who have used the client platform’s Companies and Deals (C&D) search capability have also used the Market Map functionality. Market Maps have been created in 12% of all the C&D searches. Corporate users have loved the new function, as 17.5% of all their C&D searches included creating Market Maps.
Ready to speed up your Software Development?
Explore the solutions we offer to see how we can assist you!
Schedule a Call